
Device Analytics
Every device in view.
Device Analytics monitors every device in your installation: load, temperature, network and services – live and as history, with alerts before anything fails.
See problems before anyone notices
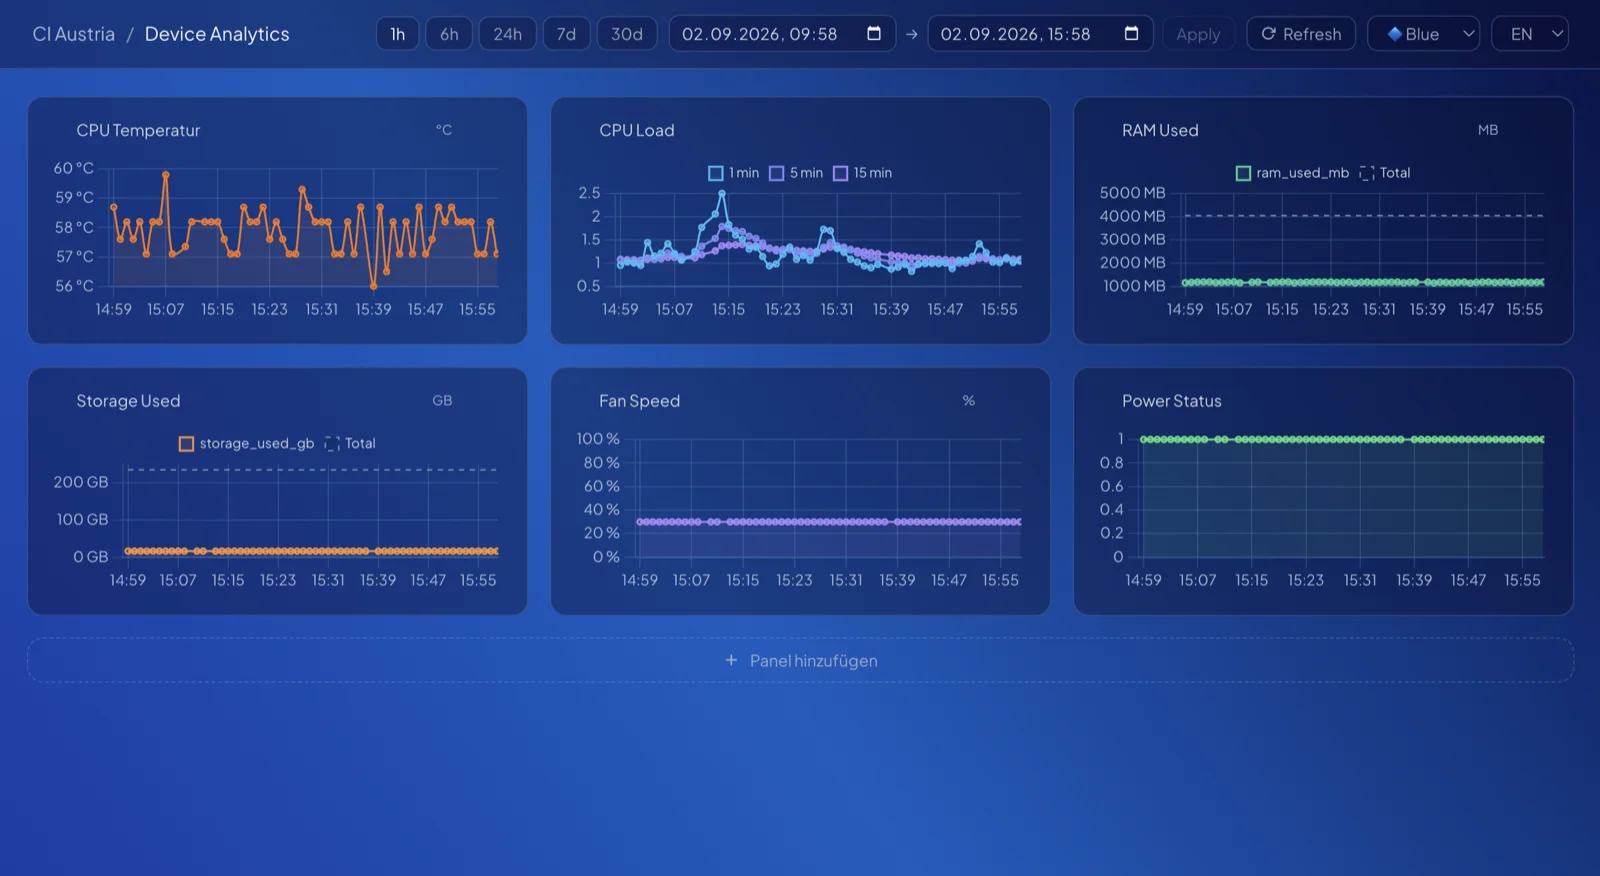
Every nanoblue device continuously reports its vital signs: CPU load, temperature, memory, network quality, service status. Device Analytics collects this data centrally, displays it live and keeps the history – making creeping problems visible long before they cause an outage.
Thresholds and alerts notify the team automatically – via dashboard, e-mail or messenger. And if something does go wrong, direct remote access cuts diagnosis from hours to minutes.
What's inside
Live vitals
CPU, temperature, memory, network and services in real time.
History
Time series instead of snapshots – spot trends and creeping faults.
Alerts
Define thresholds, receive notifications automatically.
Fleet overview
All devices at a glance – grouped by site, customer or project.
Remote access
Straight from alert to diagnosis – no on-site visit.
Reports
Documented availability and health – ideal for service contracts.